Page 28 - 2board23full
P. 28
05. Financial Performance
Chart 5.4 Table 5.1
2010 vs. 2009 Operating Expenses Highlights of the 2009-2010 Profit & Loss Statement
Financial results 2009 2010
(in million Euros) 419.5 406.4
(141.5) (127.9)
Operating Revenues & ADF 278.0 278.4
Operating Expenses
EBITDA 111.9 0.0
(72.9) (72.2)
Extraordinary Income (52.5) (47.7)
Amortisation & Depreciation
Financial Expenses 264.5 158.5
Profit (Loss) before Tax (68.8) (35.7)
(14.0) (26.3)
Income Tax of the year
Special once off tax contribution 181.7 96.6
Profit after Tax
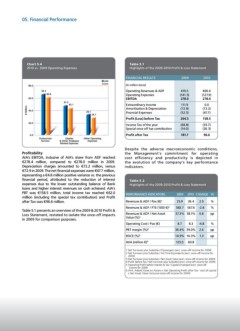
Profitability Despite the adverse macroeconomic conditions,
AIA’s EBITDA, inclusive of AIA’s share from ADF reached the Management’s commitment for operating
€278.4 million, compared to €278.0 million in 2009. cost efficiency and productivity is depicted in
Depreciation charges amounted to €72.2 million, versus the evolution of the company’s key performance
€72.9 in 2009. The net financial expenses were €47.7 million, indicators.
representing a €4.8 million positive variance vs. the previous
financial period, attributed to the reduction of interest Table 5.2
expenses due to the lower outstanding balance of Bank Highlights of the 2009-2010 Profit & Loss Statement
loans and higher interest revenues on cash achieved. AIA’s
PBT was €158.5 million, total income tax reached €62.0 Performance Indicators 2009 2010 change in
million (including the special tax contribution) and Profit
after Tax was €96.6 million. Revenues & ADF / Pax (€)1 25.9 26.4 2.0 %
Revenues & ADF / FTE (‘000 €)2 583.7 567.6 -2.8 %
Table 5.1 presents an overview of the 2009 & 2010 Profit & Revenues & ADF / Net Asset 37.3% 38.1% 0.8 pp
Loss Statement, restated to isolate the once-off impacts Value (%)3
in 2009 for comparison purposes. Operating Cost / Pax (€)
PBT margin (%)4
ROCE (%)5 8.7 8.3 -4.8 %
AVA (million €)6 36.4% 39.0% 2.6 pp
14.9% 16.3% 1.3 pp
125.5 60.8
1 Net Turnover plus Subsidies / Passengers (excl. once-off income for 2009)
2 Net Turnover plus Subsidies / Full Time Equivalents (excl. once-off income for
2009)
3 Net Turnover plus Subsidies / Net Asset Value (excl. once-off income for 2009)
4 Profit before Tax / Net turnover plus Subsidies (excl. once-off income for 2009)
5 Operating Profit before Interest & Tax / Capital Employed (excl. once-off
income for 2009)
6 AVA: Added Value on Assets = Net Operating Profit after Tax - cost of capital
x Net Asset Value (inclusive once-off income for 2009)
Chart 5.4 Table 5.1
2010 vs. 2009 Operating Expenses Highlights of the 2009-2010 Profit & Loss Statement
Financial results 2009 2010
(in million Euros) 419.5 406.4
(141.5) (127.9)
Operating Revenues & ADF 278.0 278.4
Operating Expenses
EBITDA 111.9 0.0
(72.9) (72.2)
Extraordinary Income (52.5) (47.7)
Amortisation & Depreciation
Financial Expenses 264.5 158.5
Profit (Loss) before Tax (68.8) (35.7)
(14.0) (26.3)
Income Tax of the year
Special once off tax contribution 181.7 96.6
Profit after Tax
Profitability Despite the adverse macroeconomic conditions,
AIA’s EBITDA, inclusive of AIA’s share from ADF reached the Management’s commitment for operating
€278.4 million, compared to €278.0 million in 2009. cost efficiency and productivity is depicted in
Depreciation charges amounted to €72.2 million, versus the evolution of the company’s key performance
€72.9 in 2009. The net financial expenses were €47.7 million, indicators.
representing a €4.8 million positive variance vs. the previous
financial period, attributed to the reduction of interest Table 5.2
expenses due to the lower outstanding balance of Bank Highlights of the 2009-2010 Profit & Loss Statement
loans and higher interest revenues on cash achieved. AIA’s
PBT was €158.5 million, total income tax reached €62.0 Performance Indicators 2009 2010 change in
million (including the special tax contribution) and Profit
after Tax was €96.6 million. Revenues & ADF / Pax (€)1 25.9 26.4 2.0 %
Revenues & ADF / FTE (‘000 €)2 583.7 567.6 -2.8 %
Table 5.1 presents an overview of the 2009 & 2010 Profit & Revenues & ADF / Net Asset 37.3% 38.1% 0.8 pp
Loss Statement, restated to isolate the once-off impacts Value (%)3
in 2009 for comparison purposes. Operating Cost / Pax (€)
PBT margin (%)4
ROCE (%)5 8.7 8.3 -4.8 %
AVA (million €)6 36.4% 39.0% 2.6 pp
14.9% 16.3% 1.3 pp
125.5 60.8
1 Net Turnover plus Subsidies / Passengers (excl. once-off income for 2009)
2 Net Turnover plus Subsidies / Full Time Equivalents (excl. once-off income for
2009)
3 Net Turnover plus Subsidies / Net Asset Value (excl. once-off income for 2009)
4 Profit before Tax / Net turnover plus Subsidies (excl. once-off income for 2009)
5 Operating Profit before Interest & Tax / Capital Employed (excl. once-off
income for 2009)
6 AVA: Added Value on Assets = Net Operating Profit after Tax - cost of capital
x Net Asset Value (inclusive once-off income for 2009)