Page 25 - 2board23full
P. 25
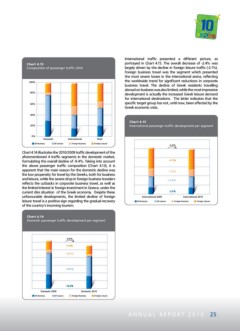
Chart 4.13 International traffic presented a different picture, as
Composition of passenger traffic 2010 portrayed in Chart 4.15. The overall decrease of -2.4% was
largely driven by the decline in foreign leisure traffic (-2.1%).
Foreign business travel was the segment which presented
the most severe losses in the international arena, reflecting
the worldwide trend for significant reductions in corporate
business travel. The decline of Greek residents travelling
abroad on business was also limited, while the most impressive
development is actually the increased Greek leisure demand
for international destinations. The latter indicates that the
specific target group has not, until now, been affected by the
Greek economic crisis.
Chart 4.15
International passenger traffic development per segment
Chart 4.14 illustrates the 2010/2009 traffic development of the
aforementioned 4 traffic segments in the domestic market,
formulating the overall decline of -9.4%. Taking into account
the above passenger traffic composition (Chart 4.13), it is
apparent that the main reason for the domestic decline was
the low propensity for travel by the Greeks, both for business
and leisure, while the severe drop in foreign business travelers
reflects the cutbacks in corporate business travel, as well as
the limited interest in foreign investment in Greece, under the
current dire situation of the Greek economy. Despite these
unfavourable developments, the limited decline of foreign
leisure travel is a positive sign regarding the gradual recovery
of the country’s incoming tourism.
Chart 4.14
Domestic passenger traffic development per segment
A N N U A L R E P O R T 2 0 1 0 25
Composition of passenger traffic 2010 portrayed in Chart 4.15. The overall decrease of -2.4% was
largely driven by the decline in foreign leisure traffic (-2.1%).
Foreign business travel was the segment which presented
the most severe losses in the international arena, reflecting
the worldwide trend for significant reductions in corporate
business travel. The decline of Greek residents travelling
abroad on business was also limited, while the most impressive
development is actually the increased Greek leisure demand
for international destinations. The latter indicates that the
specific target group has not, until now, been affected by the
Greek economic crisis.
Chart 4.15
International passenger traffic development per segment
Chart 4.14 illustrates the 2010/2009 traffic development of the
aforementioned 4 traffic segments in the domestic market,
formulating the overall decline of -9.4%. Taking into account
the above passenger traffic composition (Chart 4.13), it is
apparent that the main reason for the domestic decline was
the low propensity for travel by the Greeks, both for business
and leisure, while the severe drop in foreign business travelers
reflects the cutbacks in corporate business travel, as well as
the limited interest in foreign investment in Greece, under the
current dire situation of the Greek economy. Despite these
unfavourable developments, the limited decline of foreign
leisure travel is a positive sign regarding the gradual recovery
of the country’s incoming tourism.
Chart 4.14
Domestic passenger traffic development per segment
A N N U A L R E P O R T 2 0 1 0 25