Page 21 - 2board23full
P. 21
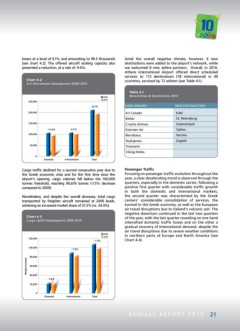
losses at a level of 6.1% and amounting to 99.3 thousands Amid the overall negative climate, however, 6 new
(see chart 4.2). The offered aircraft seating capacity also destinations were added to the airport’s network, while
presented a reduction, at a rate of -9.6%. we welcomed 8 new airline partners. Overall, in 2010,
Athens International Airport offered direct scheduled
Chart 4.2 services to 113 destinations (78 international) in 49
A/C Movements Development 2009-2010 countries, serviced by 72 airlines (see Table 4.1).
Table 4.1
New Airlines & Destinations 2010
New airlines New destinations
Air Canada Erbil
Bellair St. Petersburg
Croatia Airlines Sulamaniyah
Estonian Air Tallinn
Meridiana Verona
SkyExpress Zagreb
Transaero
Viking Hellas
Cargo traffic declined for a second consecutive year due to Passenger Traffic
the Greek economic crisis and for the first time since the Focusing on passenger traffic evolution throughout the
airport’s opening, cargo volumes fell below the 100,000 year, a clear decelerating trend is observed through the
tonnes threshold, reaching 96,676 tonnes (-7.5% decrease quarters, especially in the domestic sector; following a
compared to 2009). positive first quarter with considerable traffic growth
in both the domestic and international markets,
Nonetheless, and despite the overall decrease, total cargo the second quarter was characterized by the Greek
transported by freighter aircraft remained at 2009 levels, carriers’ considerable consolidation of services, the
achieving an increased market share of 37.3% (vs. 34.4%). turmoil in the Greek economy, as well as the European
air travel disruptions due to Iceland’s volcanic ash. The
Chart 4.3 negative downturn continued in the last two quarters
Cargo Uplift Development 2009-2010 of the year, with the last quarter revealing on one hand
intensified domestic traffic losses and on the other a
gradual recovery of international demand, despite the
air travel disruptions due to severe weather conditions
in northern parts of Europe and North America (see
Chart 4.4).
A N N U A L R E P O R T 2 0 1 0 21
(see chart 4.2). The offered aircraft seating capacity also destinations were added to the airport’s network, while
presented a reduction, at a rate of -9.6%. we welcomed 8 new airline partners. Overall, in 2010,
Athens International Airport offered direct scheduled
Chart 4.2 services to 113 destinations (78 international) in 49
A/C Movements Development 2009-2010 countries, serviced by 72 airlines (see Table 4.1).
Table 4.1
New Airlines & Destinations 2010
New airlines New destinations
Air Canada Erbil
Bellair St. Petersburg
Croatia Airlines Sulamaniyah
Estonian Air Tallinn
Meridiana Verona
SkyExpress Zagreb
Transaero
Viking Hellas
Cargo traffic declined for a second consecutive year due to Passenger Traffic
the Greek economic crisis and for the first time since the Focusing on passenger traffic evolution throughout the
airport’s opening, cargo volumes fell below the 100,000 year, a clear decelerating trend is observed through the
tonnes threshold, reaching 96,676 tonnes (-7.5% decrease quarters, especially in the domestic sector; following a
compared to 2009). positive first quarter with considerable traffic growth
in both the domestic and international markets,
Nonetheless, and despite the overall decrease, total cargo the second quarter was characterized by the Greek
transported by freighter aircraft remained at 2009 levels, carriers’ considerable consolidation of services, the
achieving an increased market share of 37.3% (vs. 34.4%). turmoil in the Greek economy, as well as the European
air travel disruptions due to Iceland’s volcanic ash. The
Chart 4.3 negative downturn continued in the last two quarters
Cargo Uplift Development 2009-2010 of the year, with the last quarter revealing on one hand
intensified domestic traffic losses and on the other a
gradual recovery of international demand, despite the
air travel disruptions due to severe weather conditions
in northern parts of Europe and North America (see
Chart 4.4).
A N N U A L R E P O R T 2 0 1 0 21