Page 22 - 2board23full
P. 22
04. Market Overview
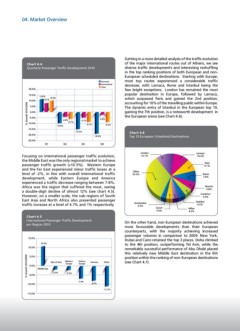
Chart 4.4 Getting in a more detailed analysis of the traffic evolution
Quarterly Passenger Traffic Development 2010 of the major international routes out of Athens, we see
diverse traffic developments and interesting reshuffling
in the top ranking positions of both European and non-
European scheduled destinations. Starting with Europe,
most top routes experienced a considerable traffic
decrease, with Larnaca, Rome and Istanbul being the
few bright exceptions. London has remained the most
popular destination in Europe, followed by Larnaca,
which surpassed Paris and gained the 2nd position,
accounting for 10% of the travelling public within Europe.
The dynamic entry of Istanbul in the European top 10,
gaining the 7th position, is a noteworth development in
the European arena (see Chart 4.6).
Chart 4.6
Top 10 European Scheduled Destinations
Focusing on international passenger traffic evolution, On the other hand, non-European destinations achieved
the Middle East was the only regional market to achieve more favourable developments than their European
passenger traffic growth (+10.3%). Western Europe counterparts, with the majority achieving increased
and the Far East experienced minor traffic losses at a passenger volumes in comparison to 2009. New York,
level of -2%, in line with overall international traffic Dubai and Cairo retained the top 3 places. Doha climbed
development, while Eastern Europe and America to the 4th position, outperforming Tel Aviv, while the
experienced a traffic decrease ranging between 7-8%. remarkably successful performance of Abu Dhabi placed
Africa was the region that suffered the most, seeing this relatively new Middle East destination in the 6th
a double-digit decline of almost 12% (see chart 4.5). position within the ranking of non-European destinations
However, on a smaller scale, the sub-regions of South (see Chart 4.7).
East Asia and North Africa also presented passenger
traffic increase at a level of 4.7% and 1% respectively.
Chart 4.5
International Passenger Traffic Development
per Region 2010
Chart 4.4 Getting in a more detailed analysis of the traffic evolution
Quarterly Passenger Traffic Development 2010 of the major international routes out of Athens, we see
diverse traffic developments and interesting reshuffling
in the top ranking positions of both European and non-
European scheduled destinations. Starting with Europe,
most top routes experienced a considerable traffic
decrease, with Larnaca, Rome and Istanbul being the
few bright exceptions. London has remained the most
popular destination in Europe, followed by Larnaca,
which surpassed Paris and gained the 2nd position,
accounting for 10% of the travelling public within Europe.
The dynamic entry of Istanbul in the European top 10,
gaining the 7th position, is a noteworth development in
the European arena (see Chart 4.6).
Chart 4.6
Top 10 European Scheduled Destinations
Focusing on international passenger traffic evolution, On the other hand, non-European destinations achieved
the Middle East was the only regional market to achieve more favourable developments than their European
passenger traffic growth (+10.3%). Western Europe counterparts, with the majority achieving increased
and the Far East experienced minor traffic losses at a passenger volumes in comparison to 2009. New York,
level of -2%, in line with overall international traffic Dubai and Cairo retained the top 3 places. Doha climbed
development, while Eastern Europe and America to the 4th position, outperforming Tel Aviv, while the
experienced a traffic decrease ranging between 7-8%. remarkably successful performance of Abu Dhabi placed
Africa was the region that suffered the most, seeing this relatively new Middle East destination in the 6th
a double-digit decline of almost 12% (see chart 4.5). position within the ranking of non-European destinations
However, on a smaller scale, the sub-regions of South (see Chart 4.7).
East Asia and North Africa also presented passenger
traffic increase at a level of 4.7% and 1% respectively.
Chart 4.5
International Passenger Traffic Development
per Region 2010