Page 42 - Ath Airport Profile
P. 42
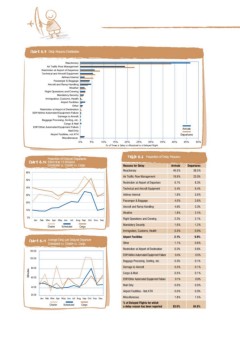
CChhaarrtt66.9.9 Delay Reasons Distribution
Reactionary Arrivals
Air Traffic Flow Management Departures
Restriction at Airport of Departure
Technical and Aircraft Equipment
Airlines Internal
Passenger & Baggage
Aircraft and Ramp Handling
Weather
Flight Operations and Crewing
Mandatory Security
Immigration, Customs, Health
Airport Facilities
Other
Restriction at Airport of Destination
EDP/Airline Automated Equipment Failure
Damage to Aircraft
Baggage Procesing, Sorting, etc.
Cargo & Mail
EDP/Other Automated Equipment Failure
Mail Only
Airport Facilities, not ATH
Miscellaneous
0% 5% 10% 15% 20% 25% 30% 35% 40% 45% 50%
% of Times a Delay is Allocated to a Delayed Flight
Proportion of Delayed Departures Table 6.2 Proportion of Delay Reasons
Chart 6.10 (More than 15 Minutes) Reasons for Delay Arrivals Departures
Reactionary 46.5% 38.5%
Scheduled vs. Charter vs. Cargo Air Traffic Flow Management 18.9% 23.0%
Restriction at Airport of Departure 6.1% 8.3%
60% Technical and Aircraft Equipment 5.4% 6.4%
Airlines Internal 1.8% 5.6%
50% Passenger & Baggage 4.0% 3.8%
Aircraft and Ramp Handling 4.6% 3.3%
40% Weather 1.8% 2.4%
Flight Operations and Crewing 2.2% 2.1%
30% Mandatory Security 1.6% 1.2%
Immigration, Customs, Health 0.3% 0.9%
20% Airport Facilities 2.1% 0.9%
Other 1.1% 0.8%
10% Restriction at Airport of Destination 0.2% 0.6%
EDP/Airline Automated Equipment Failure 0.4% 0.5%
0% Baggage Procesing, Sorting, etc. 0.3% 0.1%
Jan Feb Mar Apr May Jun Jul Aug Sep Oct Nov Dec Damage to Aircraft 0.3% 0.1%
Cargo & Mail 0.5% 0.1%
Charter Scheduled Cargo EDP/Other Automated Equipment Failure 0.1% 0.0%
Mail Only 0.0% 0.0%
Chart 6.11 Average Delay per Delayed Departure Airport Facilities - Not ATH 0.0% 0.0%
Miscellaneous 1.8% 1.5%
Scheduled vs. Charter vs. Cargo % of Delayed Flights for which
a delay reason has been reported 83.0% 84.6%
120.00
100.00
Minutes 80.00
60.00
40.00
20.00
Jan Feb Mar Apr May Jun Jul Aug Sep Oct Nov Dec
Charter Scheduled Cargo