Page 47 - Ath Airport Profile
P. 47
Our Grade Report 45
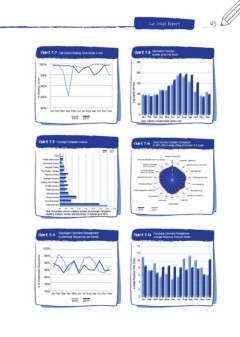
Chart 7.7 Call Centre Waiting Time Under 2 min Chart 7.8 Information Provision
Queries at the Info Desks
100%
95% 250
90%
85% 200
80%
Jan Feb Mar Apr May Jun Jul Aug Sep Oct Nov Dec
2010 2011
% Waiting<2min 150
Avg Queries per Hour
100
50
0 10 11 10 11 10 11 10 11 10 11 10 11 10 11 10 11 10 11 10 11 10 11 10 11
Jan Feb Mar Apr May Jun Jul Aug Sep Oct Nov Dec
Note: Statistics Include Mobile Agents Load
Chart 7.9 Passenger Complaints Analysis Chart 7.10 Airport Services Evaluation Comparison
of 2011-2010 Average Rating of Services (1-5 scale)
2010 2011
PRMs SENSE OF SECURITY
Facility Maintenance
Information Screens BAGGAGE DELIVERY (airline / gh services) 5 TERMINAL AMBIENCE
Baggage Trolleys 3.77 AIRPORT STAFF COURTESY
Way Finding / Signage AIRCRAFT BOARDING 3.68 3.90
Cleaning Services (airline / gh services) 3.76 3.65
Information Services 4 3.77 PRM FACILITIES
Seating / Rest Facilities CHECK-IN SERVICES 3.83 3
IT Public Systems (airline / gh services) 2 3.96 TERMINAL SIGNAGE
Retail & Services 1
Parking Services BAGGAGE TROLLEYS 3.65
Security Services
Food & Beverage PARKING SERVICES 3.50 3.66 INFO SERVICES
Aviation Services
3.41 3.92
0% 4% 8% 12% 16% 20% 24% 28% 32% OTHER COMMERCIAL SERVICES FIDS MONITORS
Note: The aviation services category includes all passenger complaints 3.37 3.48
related to aviations services and not the top 15 reported up to 2010
RESTAURANTS 3.69 3.77 SEATING AVAILABILITY
3.90
SHOPPING COMFORT
CLEANLINESS
2010 2011
Chart 7.11 Passenger Comment Management Chart 7.12 Passenger Comment Management
Customised Responses per Month Average Response Time per Month
100% 14
95% 12
90% 10
85% 8
80% 6
75% 4
70% Jan Feb Mar Apr May Jun Jul Aug Sep Oct Nov Dec 2
2010 2011 0 10 11 10 11 10 11 10 11 10 11 10 11 10 11 10 11 10 11 10 11 10 11 10 11
% of Customised Responses
Average Response Time (Days) Jan Feb Mar Apr May Jun Jul Aug Sep Oct Nov Dec