Page 41 - Ath Airport Profile
P. 41
Exercises on Punctuality 39
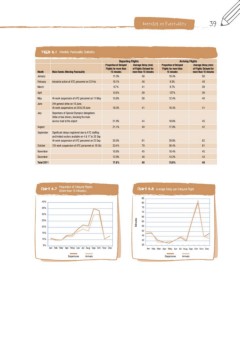
Table 6.1 Monthly Puntcuality Statistics
Departing Flights Arriving Flights
Proportion of Delayed Average Delay (min) Proportion of Delayed Average Delay (min)
Flights for more than of Flights Delayed for Flights for more than of Flights Delayed for
Month Main Events Affecting Punctuality 15 minutes more than 15 minutes 15 minutes more than 15 minutes
January
11.3% 48 10.4% 50
February Industrial action of ATC personnel on 23 Feb 10.1% 48 9.5% 49
March 9.7% 41 9.7% 39
April 13.5% 39 127% 39
May 4h work suspension of ATC personnel on 11 May 13.8% 38 12.4% 40
June 24h general strike on 15 June. 18.3% 41 16.4% 41
4h work suspensions on 28 & 29 June
July Departures of Special Olympics delegations 21.9% 44 18.6% 45
Strike of taxi drivers, blocking the main 17.0% 42
access road to the airport
August 21.1% 40
September Significant delays registered due to ATC staffing 35.0% 61 29.8% 62
October and limited sectors available on 4 & 17 to 25 Sep 33.4% 79 30.4% 81
4h work suspension of ATC personnel on 22 Sep 10.4% 45
13.2% 43
12h work suspension of ATC personnel on 19 Oct 15.9% 48
November 10.6% 45
December 12.9% 48
Total 2011 17.6% 48
Chart 6.7 Proportion of Delayed Flights Chart 6.8 Average Delay per Delayed Flight
(More than 15 Minutes)
40% Minutes 85
35% 80
30% 75
25% 70
20% 65
15% 60
10% 55
5% 50
45
Jan Feb Mar Apr May Jun Jul Aug Sep Oct Nov Dec 40
35
Jan Feb Mar Apr May Jun Jul Aug Sep Oct Nov Dec
Departures Arrivals Departures Arrivals