Page 18 - Ath Airport Profile
P. 18
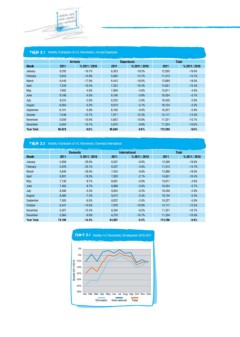
Table 3.1 Monthly Distribution of A/C Movements: Arrivals/Departures
Arrivals Departures Total
% 2011 / 2010 % 2011 / 2010
Month 2011 -19.7% 2011 % 2011 / 2010 2011 -19.6%
January 6,292 -14.8% 12,595 -14.7%
February 5,653 -17.9% 6,303 -19.5% 11,313 -18.0%
March 6,446 -10.4% 12,889 -10.4%
April 7,329 -4.6% 5,660 -14.7% 14,651 -4.6%
May 7,902 -5.5% 15,811 -5.7%
June 8,188 -2.8% 6,443 -18.0% 16,354 -2.8%
July 9,224 -5.2% 18,450 -5.2%
August 9,064 -5.8% 7,322 -10.4% 18,134 -5.9%
September 8,161 -12.7% 16,327 -12.5%
October 7,046 -10.6% 7,909 -4.6% 14,117 -10.7%
November 5,659 -10.1% 11,321 -10.0%
December 5,664 -9.6% 8,166 -5.8% 11,334 -9.6%
Year Total 86,628 173,296
9,226 -2.8%
9,070 -5.1%
8,166 -6.0%
7,071 -12.3%
5,662 -10.8%
5,670 -9.8%
86,668 -9.6%
Table 3.2 Monthly Distribution of A/C Movements: Domestic/International
Month Domestic International 2011 Total
January 2011 % 2011 / 2010 2011 % 2011 / 2010 12,595 % 2011 / 2010
February 11,313 -19.6%
March 5,658 -29.0% 6,937 -9.9% 12,889 -14.7%
April 14,651 -18.0%
May 5,076 -25.1% 6,237 -4.0% 15,811 -10.4%
June 16,354 -4.6%
July 5,846 -26.0% 7,043 -9.8% 18,450 -5.7%
August 18,134 -2.8%
September 6,831 -18.3% 7,820 -2.1% 16,327 -5.2%
October 14,117 -5.9%
November 7,130 -8.7% 8,681 -0.9% 11,321 -12.5%
December 11,334 -10.7%
Year Total 7,465 -8.7% 8,889 -3.0% 173,296 -10.0%
-9.6%
8,596 -5.5% 9,854 -0.3%
8,560 -7.2% 9,574 -3.3%
7,505 -9.5% 8,822 -2.6%
6,441 -14.6% 7,676 -10.8%
5,027 -13.4% 6,294 -8.5%
5,064 -9.0% 6,270 -10.7%
79,199 -14.4% 94,097 -5.2%
Chart 3.1 Monthly A/C Movements Development 2010-2011
Growth 2011/2010 0%
-5%
-10%
-15%
-20%
-25%
-30%
-35%
Jan Feb Mar Apr May Jun Jul Aug Sep Oct Nov Dec
Domestic International Total