Page 20 - Ath Airport Profile
P. 20
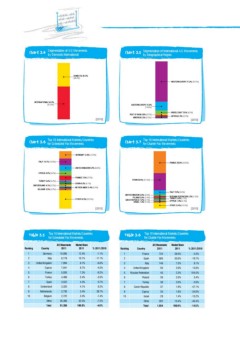
Chart 3.4 Segmentation of A/C Movements Chart 3.5 Segmentation of International A/C Movements
by Domestic/International by Geographical Region
+64,:;0*
BD
>,:;,95,<967,BD
05;,95(;065(3 ,(:;,95,<967,
BD BD
BD 9,:;6-(:0(BD 40++3,,(:; BD
(4,90*(BD (-90*(BD
BD
Chart 3.6 Top 10 International Markets/Countries Chart 3.7 Top 10 International Markets/Countries
for Scheduled Pax Movements for Charter Pax Movements
0;(3@BD .,94(5@BD :7(05B D -9(5*,B D
*@79<:BD <50;,+205.+64B D <50;,+205.+64BD 0;(3@BD
-9(5*,BD 763(5+BD 9;<<9:2:,0(@5-,+,B9(;06D5BD
;<92,@BD :7(05BD *@79<:BD
:>0;A,93(5+BD 5,;/,93(5+:BD *A,*/9,7<)30* BD 6;/,9BD
0:9(,3BD
),3.0<4BD 6;/,9BD BD
BD
Table 3.5 Top 10 International Markets/Countries Table 3.6 Top 10 International Markets/Countries
for Scheduled Pax Movements for Charter Pax Movements
Ranking Country A/C Movements Market Share % 2011/2010 Ranking Country A/C Movements Market Share % 2011/2010
2011 2011 -1.1% 2011 2011 -4.3%
1 Germany -11.1% 1 France -19.7%
10,095 12.4% -6.0% 734 38.0% 8.1%
2 Italy 8,178 10.1% -4.5% 2 Spain 580 30.0% 13.6%
7,094 8.7% -9.2% 146 7.5%
3 United Kingdom 7,041 8.7% -3.5% 3 Italy 50 2.6% 104.5%
5,935 7.3% 0.7% 45 2.3% 5.4%
4 Cyprus 4,408 5.4% 6.2% 4 United Kingdom 39 2.0% -2.6%
3,522 4.3% 28.7% 38 2.0%
5 France 3,325 4.1% -1.4% 5 Russian Federation 37 1.9% -47.1%
2,730 3.4% -7.2% 35 1.8% -34.0%
6 Turkey 2,722 3.3% -4.6% 6 Poland 28 1.4% -15.2%
26,306 32.3% 202 10.4% -40.4%
7 Spain 81,356 100.0% 7 Turkey 1,934 100.0% -14.5%
8 Switzerland 8 Czech Republic
9 Netherlands 9 Cyprus
10 Belgium 10 Israel
Other Other
Total Total