Page 48 - Aerostat Handbook 2015
P. 48
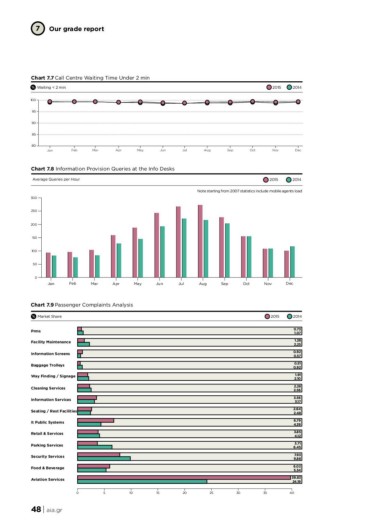
7 Our grade report
Chart 7.7 Call Centre Waiting Time Under 2 min 2015 2014
Waiting < 2 min
100 Feb Mar Apr May Jun Jul Aug Sep Oct Nov Dec
95
90
85
80
Jan
Chart 7.8 Information Provision Queries at the Info Desks 2015 2014
Average Queries per Hour
Note starting from 2007 statistics include mobile agents load
300 Feb Mar Apr May Jun Jul Aug Sep Oct Nov Dec
250
200
150
100
50
0
Jan
Chart 7.9 Passenger Complaints Analysis 2015 2014
Market Share
Prms 0.73
Facility Maintenance 1.07
Information Screens
Baggage Trolleys 1.28
Way Finding / Signage 2.25
Cleaning Services
Information Services 0.92
Seating / Rest Facilities 0.57
It Public Systems
Retail & Services 0.51
Parking Services 0.92
Security Services
Food & Beverage 1.91
Aviation Services 2.10
2.28
2.56
3.56
3.17
2.64
2.48
6.79
4.39
3.85
4.12
3.71
6.45
7.93
9.88
6.02
5.34
39.83
24.19
0 5 10 15 20 25 30 35 40
48 | aia.gr