Page 43 - Aerostat Handbook 2015
P. 43
Aerostat Handbook 2015
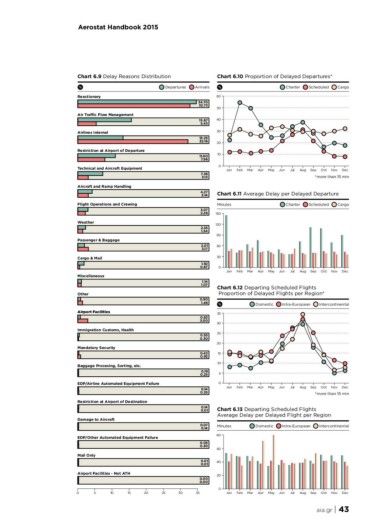
Chart 6.9 Delay Reasons Distribution Chart 6.10 Proportion of Delayed Departures*
Departures Arrivals Charter Scheduled Cargo
34.70
Reactionary 32.73 60
50
Air Traffic Flow Management
Airlines Internal 15.67 40
5.43 30
13.25 20
32.16
Restriction at Airport of Departure
Technical and Aircraft Equipment 11.00 10
7.96
7.36 0
3.13 Jan Feb Mar Apr May Jun Jul Aug Sep Oct Nov Dec
*more than 15 min
Aircraft and Ramp Handling
4.27 Chart 6.11 Average Delay per Delayed Departure
3.14
Flight Operations and Crewing Minutes Charter Scheduled Cargo
150
3.07
2.26
Weather 120
90
2.35
1.54
Passenger & Baggage
Cargo & Mail 2.01 60
3.17
Miscellaneous 1.92 30
0.67
Other 1.14 0
1.07 Jan Feb Mar Apr May Jun Jul Aug Sep Oct Nov Dec
Airport Facilities 0.90
1.48 Chart 6.12 Departing Scheduled Flights
Immigration Customs, Health 0.82 Proportion of Delayed Flights per Region*
3.00
Mandatory Security 0.55 Domestic Intra-European Intercontinental
0.30 35
Baggage Procesing, Sorting, etc. 0.42 30
0.92
EDP/Airline Automated Equipment Failure 0.19 25
0.25
0.14 20
0.35
15
10
5
0
Jan Feb Mar Apr May Jun Jul Aug Sep Oct Nov Dec
*more than 15 min
Restriction at Airport of Destination
0.14 Chart 6.13 Departing Scheduled Flights
0.01
Average Delay per Delayed Flight per Region
Damage to Aircraft
0.07 Minutes Domestic Intra-European Intercontinental
0.14 80
EDP/Other Automated Equipment Failure 0.05
0.30 60
Mail Only
0.01 40
0.01
Airport Facilities - Not ATH 20
0 5 10 15 20 25 30 0.00 0
0.00 Jan Feb Mar Apr May Jun Jul Aug Sep Oct Nov Dec
35
aia.gr | 43