Page 42 - Aerostat Handbook 2015
P. 42
6 Exercises on punctuality
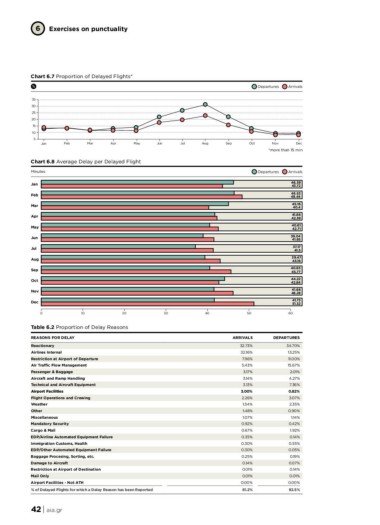
Chart 6.7 Proportion of Delayed Flights*
Departures Arrivals
35
30
25
20
15
10
5
Jan Feb Mar Apr May Jun Jul Aug Sep Oct Nov Dec
*more than 15 min
Chart 6.8 Average Delay per Delayed Flight
Departures Arrivals
Minutes
46.39
Jan 10 20 30 43.72
Feb 46.53
Mar 48.44
Apr 45.16
May 40.4
Jun 41.86
Jul 42.39
Aug 40.61
Sep 42.71
Oct 39.04
Nov 41.65
Dec 37.17
0 41.5
39.47
43.16
40.65
45.77
44.22
42.84
41.66
46.28
41.73
51.32
40 50 60
Table 6.2 Proportion of Delay Reasons ARRIVALS DEPARTURES
REASONS FOR DELAY 32.73% 34.70%
32.16% 13.25%
Reactionary 7.96% 11.00%
Airlines Internal 5.43% 15.67%
Restriction at Airport of Departure
Air Traffic Flow Management 3.17% 2.01%
Passenger & Baggage 3.14% 4.27%
Aircraft and Ramp Handling 3.13% 7.36%
Technical and Aircraft Equipment 3.00% 0.82%
Airport Facilities 2.26% 3.07%
Flight Operations and Crewing 1.54% 2.35%
Weather 1.48% 0.90%
Other 1.07%
Miscellaneous 0.92% 1.14%
Mandatory Security 0.67% 0.42%
Cargo & Mail 0.35% 1.92%
EDP/Airline Automated Equipment Failure 0.30% 0.14%
Immigration Customs, Health 0.30% 0.55%
EDP/Other Automated Equipment Failure 0.25% 0.05%
Baggage Procesing, Sorting, etc. 0.14% 0.19%
Damage to Aircraft 0.01% 0.07%
Restriction at Airport of Destination 0.01% 0.14%
Mail Only 0.00% 0.01%
Airport Facilities - Not ATH 0.00%
81.2%
% of Delayed Flights for which a Delay Reason has been Reported 92.5%
42 | aia.gr