Page 12 - Ath Airport Profile
P. 12
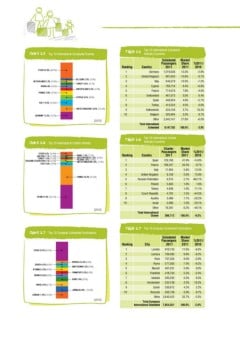
Chart 2.5 Top 10 International Scheduled Markets Table 2.5 Top 10 International Scheduled
Markets/Countries
6;/,9BD Ranking Country Scheduled Market %2011/
1 Passengers Share 2010
5,;/,93(5+:BD 2 2011
:7(05 B D 3 2011 13.3% -2.9%
4 10.8% -3.7%
-9(5*,B D 5 Germany 1,219,536 10.3% -7.2%
0;(3@BD 6 8.4% -6.8%
),3.0<4BD 7 United Kingdom 991,943 7.8% -4.0%
.,94(5@BD ;<92,@BD 8 5.0% 6.4%
:>0;A,93(5+BD 9 Italy 944,379 4.9% -2.7%
*@79<:BD 10 4.5% 6.6%
Cyprus 769,716 3.7% 18.3%
<50;,+205.+64B D 3.3% 8.7%
France 714,576 27.8% -6.0%
BD
Switzerland 461,575 100.0% -2.9%
Spain 446,924
Turkey 413,324
Netherlands 334,138
Belgium 305,894
Other 2,545,147
Total International
Scheduled 9,147,152
Chart 2.6 Top 10 International Charter Markets Table 2.6 Top 10 International Charter
Markets/Countries
6;/,9BD 0:9(,3BD Ranking Country Charter Market %2011/
(<:;90(BD *A,*/9,7<)30*BD 1 Passengers Share 2010
;<92,@BD 763(5+BD 2 2011 -14.0%
9<::0(5-,+,9(;065BD <50;,+205.+64BD 3 2011 41.9% -0.7%
4 34.3% 13.4%
0;(3@BD 5 Spain 129,760 75.9%
6 5.8% 462.1%
7 France 106,247 2.6% 1.8%
8 2.1% 11.1%
9 Italy 17,954 1.8% -44.5%
10 1.6% -26.2%
-9(5*,BD United Kingdom 8,158 1.5% -20.1%
1.1% -46.1%
Russian Federation 6,515 1.0%
6.2% -9.5%
Poland 5,603
100.0%
Turkey 4,848
Czech Republic 4,781
:7(05 BD Austria 3,489
Israel 3,096
BD Other 19,261
Total International 309,712
Charter
Chart 2.7 Top 10 European Scheduled Destinations Table 2.7 Top 10 European Scheduled Destinations
Ranking Scheduled Market %2011/
Passengers Share 2010
City 2011 2011 -6.5%
11.6% -6.2%
6;/,9B D 1 London 910,733 -3.0%
9.8% -9.2%
A<90*/BD 2 Larnaca 769,483 9.0% 0.0%
0:;(5)<3BD 7.4% -2.4%
3 Paris 707,355 5.9% 8.3%
4<50*/ BD 5.3% 18.3%
7(90: B D )9<::,3: BD 4 Rome 577,565 5.0% 2.2%
(4:;,9+(4BD 4.3% 8.7%
365+65BD -9(52-<9;BD 5 Munich 461,031 4.2% -2.5%
964,B D 3.9%
6 Frankfurt 418,764 33.7% -2.0%
3(95(*( BD
7 Istanbul 393,292 100.0%
BD
8 Amsterdam 334,138
9 Zurich 330,812
10 Brussels 305,736
Other 2,645,422
Total European
International Scheduled 7,854,331
Markets/Countries
6;/,9BD Ranking Country Scheduled Market %2011/
1 Passengers Share 2010
5,;/,93(5+:BD 2 2011
:7(05 B D 3 2011 13.3% -2.9%
4 10.8% -3.7%
-9(5*,B D 5 Germany 1,219,536 10.3% -7.2%
0;(3@BD 6 8.4% -6.8%
),3.0<4BD 7 United Kingdom 991,943 7.8% -4.0%
.,94(5@BD ;<92,@BD 8 5.0% 6.4%
:>0;A,93(5+BD 9 Italy 944,379 4.9% -2.7%
*@79<:BD 10 4.5% 6.6%
Cyprus 769,716 3.7% 18.3%
<50;,+205.+64B D 3.3% 8.7%
France 714,576 27.8% -6.0%
BD
Switzerland 461,575 100.0% -2.9%
Spain 446,924
Turkey 413,324
Netherlands 334,138
Belgium 305,894
Other 2,545,147
Total International
Scheduled 9,147,152
Chart 2.6 Top 10 International Charter Markets Table 2.6 Top 10 International Charter
Markets/Countries
6;/,9BD 0:9(,3BD Ranking Country Charter Market %2011/
(<:;90(BD *A,*/9,7<)30*BD 1 Passengers Share 2010
;<92,@BD 763(5+BD 2 2011 -14.0%
9<::0(5-,+,9(;065BD <50;,+205.+64BD 3 2011 41.9% -0.7%
4 34.3% 13.4%
0;(3@BD 5 Spain 129,760 75.9%
6 5.8% 462.1%
7 France 106,247 2.6% 1.8%
8 2.1% 11.1%
9 Italy 17,954 1.8% -44.5%
10 1.6% -26.2%
-9(5*,BD United Kingdom 8,158 1.5% -20.1%
1.1% -46.1%
Russian Federation 6,515 1.0%
6.2% -9.5%
Poland 5,603
100.0%
Turkey 4,848
Czech Republic 4,781
:7(05 BD Austria 3,489
Israel 3,096
BD Other 19,261
Total International 309,712
Charter
Chart 2.7 Top 10 European Scheduled Destinations Table 2.7 Top 10 European Scheduled Destinations
Ranking Scheduled Market %2011/
Passengers Share 2010
City 2011 2011 -6.5%
11.6% -6.2%
6;/,9B D 1 London 910,733 -3.0%
9.8% -9.2%
A<90*/BD 2 Larnaca 769,483 9.0% 0.0%
0:;(5)<3BD 7.4% -2.4%
3 Paris 707,355 5.9% 8.3%
4<50*/ BD 5.3% 18.3%
7(90: B D )9<::,3: BD 4 Rome 577,565 5.0% 2.2%
(4:;,9+(4BD 4.3% 8.7%
365+65BD -9(52-<9;BD 5 Munich 461,031 4.2% -2.5%
964,B D 3.9%
6 Frankfurt 418,764 33.7% -2.0%
3(95(*( BD
7 Istanbul 393,292 100.0%
BD
8 Amsterdam 334,138
9 Zurich 330,812
10 Brussels 305,736
Other 2,645,422
Total European
International Scheduled 7,854,331