Page 10 - Ath Airport Profile
P. 10
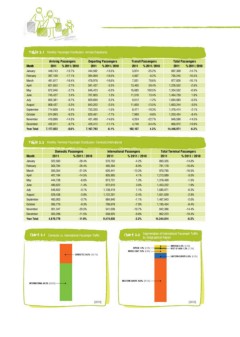
Table 2.1 Monthly Passenger Distribution: Arrivals/Departures
Arriving Passengers Departing Passengers Transit Passengers Total Passengers
Month 2011 % 2011 / 2010 2011 % 2011 / 2010 2011 % 2011 / 2010 2011 % 2011 / 2010
January
February 448,743 -15.7% 444,592 -13.5% 3,974 -25.2% 897,309 -14.7%
March
April 397,109 -17.1% 394,069 -16.0% 4,067 -6.2% 795,245 -16.5%
May
June 491,817 -16.4% 478,978 -16.6% 7,031 78.6% 977,826 -16.1%
July
August 621,652 -2.7% 591,437 -3.3% 13,463 59.4% 1,226,552 -2.6%
September
October 672,046 -2.7% 646,423 -0.3% 16,083 100.5% 1,334,552 -0.9%
November
December 745,427 2.4% 707,805 1.3% 11,518 13.4% 1,464,750 1.9%
Year Total
855,381 -0.7% 829,690 0.2% 9,012 -1.2% 1,694,083 -0.3%
808,437 -3.3% 843,202 -2.5% 11,605 -13.5% 1,663,244 -3.0%
714,608 -2.4% 753,335 -1.5% 8,471 -19.3% 1,476,414 -2.1%
574,993 -9.2% 620,461 -7.7% 7,980 -9.8% 1,203,434 -8.4%
410,898 -14.3% 431,488 -14.6% 4,204 -22.7% 846,590 -14.5%
435,911 -9.7% 426,312 -11.1% 4,749 -54.4% 866,972 -10.9%
7,177,022 -6.6% 7,167,792 -6.1% 102,157 4.3% 14,446,971 -6.3%
Table 2.2 Monthly Terminal Passenger Distribution: Domestic/International
Domestic Passengers International Passengers Total Terminal Passengers
Month 2011 % 2011 / 2010 2011 % 2011 / 2010 2011 % 2011 / 2010
January
February 322,583 -28.4% 570,752 -4.2% 893,335 -14.6%
March
April 305,784 -26.4% 485,394 -8.9% 791,178 -16.6%
May
June 350,354 -21.5% 620,441 -13.3% 970,795 -16.5%
July
August 407,184 -14.5% 805,905 4.1% 1,213,089 -3.0%
September
October 444,738 -6.6% 873,731 1.3% 1,318,469 -1.5%
November
December 480,622 -1.4% 972,610 3.6% 1,453,232 1.9%
Year Total
546,652 -3.1% 1,138,419 1.1% 1,685,071 -0.3%
529,438 -3.9% 1,122,201 -2.4% 1,651,639 -2.9%
483,003 -3.7% 984,940 -1.1% 1,467,943 -2.0%
395,776 -9.3% 799,678 -7.9% 1,195,454 -8.4%
301,347 -20.5% 541,039 -10.7% 842,386 -14.4%
303,298 -11.5% 558,925 -9.8% 862,223 -10.4%
4,870,779 -11.9% 9,474,035 -3.2% 14,344,814 -6.3%
Chart 2.1 Domestic vs. International Passenger Traffic Chart 2.2 Segmentation of International Passenger Traffic
by Geographical Region
+64,:;0*BD
(-90*(BD (4,90*(BD
40++3,,(:;B D 9,:;6-(:0(BD
,(:;,95,<967, B D
05;,95(;065(3B D >,:;,95,<967,BD
BD BD