Page 18 - Ath Airport Profile
P. 18
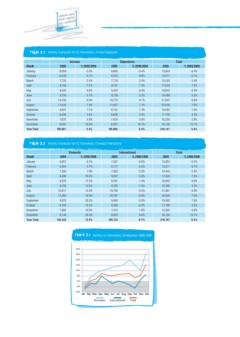
Table 3.1 Monthly Distribution of A/C Movements: Arrivals/Departures
Month 2009 Arrivals Departures 2009 Total
January 6,959 % 2009/2008 2009 % 2009/2008 13,924 % 2009/2008
February 6,538 -5.3% 13,071 -5.4%
March 7,725 0.7% 6,965 -5.4% 15,443 0.7%
April 8,766 2.4% 17,533 2.4%
May 9,420 7.4% 6,533 0.6% 18,843 7.5%
June 9,750 6.0% 19,489 6.0%
July 10,789 5.1% 7,718 2.4% 21,567 5.2%
August 11,022 6.9% 22,049 6.8%
September 9,801 7.0% 8,767 7.5% 19,582 7.0%
October 8,599 7.7% 17,199 7.6%
November 7,631 3.5% 9,423 6.0% 15,255 3.5%
December 8,091 5.8% 16,192 5.8%
Year Total 105,091 15.6% 9,739 5.2% 210,147 15.7%
5.4% 5.4%
10,778 6.7%
11,027 7.1%
9,781 7.4%
8,600 3.5%
7,624 5.8%
8,801 15.7%
105,056 5.4%
Table 3.2 Monthly Distribution of A/C Movements: Domestic/International
Month 2009 Domestic International 2009 Total
January 6,657 % 2009/2008 2009 % 2009/2008 13,924 % 2009/2008
February 6,354 -3.7% 13,071 -5.4%
March 7,550 3.7% 7,267 -6.8% 15,443 0.7%
April 8,496 7.9% 17,533 2.4%
May 9,076 10.3% 6,717 -2.0% 18,843 7.5%
June 9,706 11.5% 19,489 6.0%
July 10,817 13.5% 7,893 -2.3% 21,567 5.2%
August 11,262 14.0% 22,049 6.8%
September 9,978 15.9% 9,037 5.0% 19,582 7.0%
October 8,704 20.2% 17,199 7.6%
November 7,683 15.3% 9,767 1.4% 15,255 3.5%
December 8,140 10.3% 16,192 5.8%
Year Total 104,423 26.3% 9,783 -1.9% 210,147 15.7%
12.4% 5.4%
10,750 0.5%
10,787 -0.9%
9,604 -3.0%
8,495 -6.3%
7,572 1.6%
8,052 6.6%
105,724 -0.7%
Chart 3.1 Monthly A/C Movements Development 2008-2009
30%
25%
20%
15%
10%
5%
0%
-5%
-10%
Jan Feb Mar Apr May Jun Jul Aug Sep Oct Nov Dec
Domestic International Total