Page 54 - Aerostat Handbook 2015
P. 54
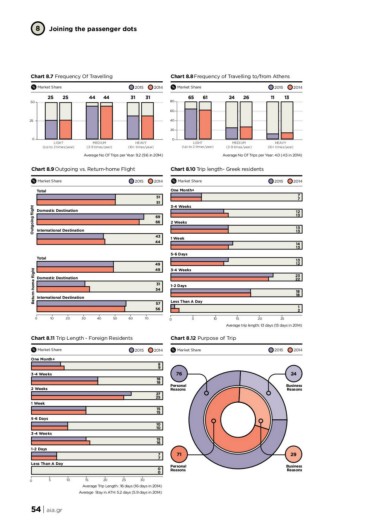
8 Joining the passenger dots
Chart 8.7 Frequency Of Travelling Chart 8.8 Frequency of Travelling to/from Athens
Market Share 2015 2014 Market Share 2015 2014
25 25 44 44 31 31 65 61 24 26 11 13
50 80
60
25 40
0 20
LIGHT
MEDIUM HEAVY 0 MEDIUM HEAVY
(Up to 2 times/year) (3-9 times/year) (10+ times/year) LIGHT (3-9 times/year) (10+ times/year)
(Up to 2 times/year)
Average No Of Trips per Year: 9.2 (9.6 in 2014) Average No Of Trips per Year: 4.0 (4.5 in 2014)
Chart 8.9 Outgoing vs. Return-home Flight Chart 8.10 Trip length- Greek residents
Market Share 2015 2014 Market Share 2015 2014
Outgoing flight Total One Month+ 7
Domestic Destination 51 7
International Destination 51 12
13
3-4 Weeks 13
13
69 14
66 2 Weeks 13
43 1 Week
44
Return-home flight Total 5-6 Days 13
Domestic Destination 49 12
International Destination 49 3-4 Weeks 23
22
31 1-2 Days 18
34 18
57 Less Than A Day 1
56 2
0 10 20 30 40 50 60 70 0 5 10 15 20 25
Average trip length: 13 days (13 days in 2014)
Chart 8.11 Trip Length - Foreign Residents Chart 8.12 Purpose of Trip
Market Share 2015 2014 Market Share 2015 2014
One Month+
3-4 Weeks 8 24
2 Weeks 9
1 Week Business
5-6 Days 76 Reasons
3-4 Weeks
1-2 Days 18
Less Than A Day 18
0 5 10
Personal
Reasons
27
25
15
15
10
10
15
16
7 71 29
7
Personal Business
0 Reasons Reasons
0
15 20 25 30
Average Trip Length : 16 days (16 days in 2014)
Average Stay in ATH: 5.2 days (5.9 days in 2014)
54 | aia.gr