Page 24 - Aerostat Handbook 2015
P. 24
3 Counting Airplanes
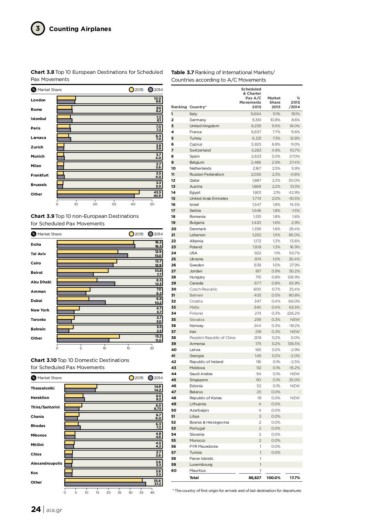
Chart 3.8 Top 10 European Destinations for Scheduled Table 3.7 Ranking of International Markets/
Pax Movements Countries according to A/C Movements
Market Share 2015 2014 Scheduled
& Charter
London 10.0 Ranking Country* Pax A/C Market %
Rome 9.6 Share 2015
Istanbul 80 Movements 2015 /2014
Paris 8.2 2015 19.1%
Larnaca 7.2 11.1% 8.6%
Zurich 8.1 1 Italy 9,664 10.8% 18.0%
Munich 7.0 2 Germany 9,361 9.5% 11.6%
Milan 7.3 3 United Kingdom 8,259 12.8%
Frankfurt 6.3 4 France 6,657 7.7% 11.0%
Brussels 7.4 5 Turkey 6,321 7.3% 10.7%
Other 3.8 6 Cyprus 5,925 6.8% 27.0%
3.8 7 Switzerland 4,283 4.9% 27.4%
3.7 8 Spain 2,633 3.0% 5.9%
4.0 9 Belgium 2,486 2.9% -0.6%
3.7 10 Netherlands 2,167 2.5% 30.0%
3.6 11 Russian Federation 2,036 2.3% 51.3%
3.5 12 Qatar 1,887 2.2% 42.9%
4.0 13 Austria 1,869 2.2% -10.5%
3.3 14 Egypt 1,801 2.1% 14.5%
3.0 15 United Arab Emirates 1,774 2.0% -1.5%
43.5 16 Israel 1,547 1.8% 1.6%
40.9 17 Serbia 1,546 1.8% 2.9%
18 Romania 1,531 1.8% 29.4%
0 10 20 30 40 50 19 Bulgaria 1,420 1.6% 85.0%
20 Denmark 1,359 1.6% 13.6%
Chart 3.9 Top 10 non-European Destinations 21 Lebanon 1,262 1.5% 16.9%
for Scheduled Pax Movements 22 Albania 1,172 1.3% 50.7%
23 Poland 1,108 1.3% 30.4%
Market Share 2015 2014 24 USA 1.1% 27.9%
25 Ukraine 922 1.0% 50.2%
Doha 16.2 26 Sweden 874 1.0% 129.9%
Tel Aviv 16.5 27 Jordan 839 0.9% 65.9%
Cairo 28 Hungary 817 0.8% 35.4%
Beirut 12.9 29 Canada 715 0.8% 80.8%
Abu Dhabi 15.0 30 Czech Republic 677 0.7% 66.0%
Amman 31 Bahrain 600 0.5% 63.5%
Dubai 12.7 32 Croatia 405 0.4% 226.2%
New York 12.9 33 Malta 347 0.4% NEW
Toronto 34 Finland 340 0.3% -19.2%
Bahrain 10.8 35 Slovakia 274 0.3% NEW
Other 7.7 36 Norway 259 0.3% 0.0%
37 Iran 244 0.3% 136.5%
8.5 38 People's Republic of China 218 0.2% -2.9%
12.3 39 Armenia 208 0.2% -2.0%
40 Latvia 175 0.2% -2.5%
7.0 41 Georgia 165 0.2% -15.2%
6.2 42 Republic of Ireland 149 0.1% NEW
43 Moldova 116 0.1% 25.0%
6.8 44 Saudi Arabia 112 0.1% NEW
10.2 45 Singapore 94 0.1%
46 Estonia 90 0.1% -
4.7 47 Belarus 0.0% NEW
3.7 48 Republic of Korea 52 0.0%
49 Lithuania 25 0.0% 17.7%
3.7 50 Azerbaijan 18 0.0%
3.0 51 Libya 0.0%
52 Bosnia & Herzegovina 4 0.0%
3.5 53 Portugal 4 0.0%
2.5 54 Slovenia 3 0.0%
55 Morocco 2 0.0%
13.2 56 FYR Macedonia 2 0.0%
11.0 57 Tunisia 2 0.0%
58 Faroe Islands 2
0 5 10 15 20 59 Luxembourg 1 100.0%
60 Mauritius 1
Chart 3.10 Top 10 Domestic Destinations 1
for Scheduled Pax Movements 1
1
Market Share 2015 2014
Thessaloniki 14.9 Total 86,827
Heraklion 14.2
Thira/Santorini 8.5
Chania 9.2
Rhodes 8.0
Mikonos 6.73
Mitilini 6.7
Chios 6.0
Alexandroupolis 6.3
Kos
Other 7.2
4.8
4.9
4.5
4.2
3.7
3.6
3.6
3.3
3.6
3.5
35.6
37.2
0 5 10 15 20 25 30 35 40 * The country of first origin for arrivals and of last destination for departures
24 | aia.gr