Page 15 - Aerostat Handbook 2015
P. 15
Aerostat Handbook 2015
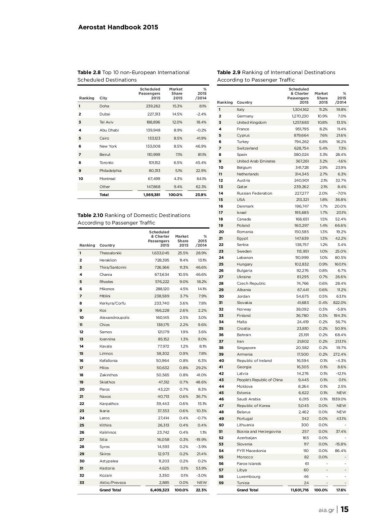
Table 2.8 Top 10 non-European International Table 2.9 Ranking of International Destinations
Scheduled Destinations According to Passenger Traffic
Ranking City Scheduled Market % Ranking Country Scheduled Market %
1 Doha Passengers Share 2015 & Charter Share 2015
2 Dubai 2015 /2014 1 Italy 2015 /2014
3 Tel Aviv 2015 15.3% 8.1% 2 Germany Passengers
4 Abu Dhabi 239,262 14.5% -2.4% 3 United Kingdom 2015 11.2% 19.8%
5 Cairo 227,313 12.0% 18.4% 4 France
6 New York 188,896 8.9% -0.2% 5 Cyprus 1,304,162 10.9% 7.0%
7 Beirut 139,948 8.5% 41.9% 6 Turkey 1,270,230
8 Toronto 8.5% 46.9% 7 Switzerland 1,257,683 10.8% 13.5%
9 Philadelphia 133,123 7.1% 81.1% 8 Spain
10 Montreal 133,008 6.5% 45.4% 9 United Arab Emirates 951,795 8.2% 11.4%
110,999 5.1% 22.9% 10 Belgium 879,664
Other 4.3% 64.1% 11 Netherlands 794,262 7.6% 21.6%
Total 101,152 9.4% 62.3% 12 Austria 628,754
80,313 23.9% 13 Qatar 380,024 6.8% 16.2%
67,499 100.0% 14 Russian Federation 367,261
147,868 15 USA 341,728 5.4% 7.3%
1,569,381 16 Denmark 314,345
17 Israel 240,901 3.3% 28.4%
18 Canada 239,262
19 Poland 227,277 3.2% -1.6%
20 Romania
21 Egypt 213,321 2.9% 23.9%
22 Serbia 196,747
23 Sweden 195,685 2.7% 6.3%
24 Lebanon 168,651
25 Hungary 160,297 2.1% 32.7%
26 Bulgaria 150,585
27 Ukraine 147,639 2.1% 8.4%
28 Czech Republic 138,757
29 Albania 113,951 2.0% -7.0%
30 Jordan 110,999
31 Slovakia 102,832 1.8% 36.8%
32 Norway 92,276
33 Finland 1.7% 20.0%
34 Malta 81,295
Table 2.10 Ranking of Domestic Destinations 35 Croatia 74,766 1.7% 20.1%
According to Passenger Traffic 36 Bahrain 67,441
37 Iran 54,675 1.5% 52.4%
38 Singapore 41,683
39 Armenia 38,092 1.4% 66.6%
40 Republic of Ireland 36,780
Scheduled 41 Georgia 24,419 1.3% 19.2%
& Charter 42 Latvia 23,810
Market % 43 People's Republic of China 1.3% 42.2%
Passengers Share 2015 44 Moldova 23,191
Ranking Country 2015 2015 /2014 45 Estonia 21,802 1.2% 3.4%
1 Thessaloniki 25.5% 28.9% 46 Saudi Arabia 20,582
2 Heraklion 1,633,045 11.4% 13.1% 47 Republic of Korea 17,500 1.0% 25.0%
3 Thira/Santorini 728,395 11.3% 46.6% 48 Belarus 16,594
4 Chania 726,566 10.5% 46.6% 49 Portugal 16,305 1.0% 80.5%
5 Rhodes 673,634 9.0% 18.2% 50 Lithuania 14,276
6 Mikonos 576,222 4.5% 14.1% 51 Bosnia and Herzegovina 9,445 0.9% 160.1%
7 Mitilini 288,120 3.7% 7.9% 52 Azerbaijan 8,264
8 Kerkyra/Corfu 238,589 3.6% 7.8% 53 Slovenia 6,622 0.8% 6.7%
9 Kos 233,740 2.6% 2.2% 54 FYR Macedonia
10 Alexandroupolis 166,228 2.5% 3.0% 55 Morocco 6,015 0.7% 26.6%
11 Chios 160,145 2.2% 9.6% 56 Faroe Islands 5,045
12 Samos 138,175 1.9% 3.6% 57 Libya 2,462 0.6% 28.4%
13 Ioannina 121,179 1.3% 9.0% 58 Luxembourg
14 Kavala 85,152 1.2% 8.1% 59 Tunisia 342 0.6% 11.2%
15 Limnos 77,972 0.9% 7.8% 300
16 Kefallonia 58,302 0.8% 6.3% Grand Total 257 0.5% 63.1%
17 Milos 50,964 0.8% 29.2% 165
18 Zakinthos 50,632 0.8% 41.0% 0.4% 822.0%
19 Skiathos 50,565 0.7% 48.6% 117
20 Paros 47,312 0.7% 8.3% 110 0.3% -5.8%
21 Naxos 43,221 0.6% 36.7% 82
22 Karpathos 40,713 0.6% 15.1% 61 0.3% 194.3%
23 Ikaria 39,443 0.6% 10.3% 60
24 Leros 37,353 0.4% -0.7% 46 0.2% 56.7%
25 Kithira 27,414 0.4% 0.4% 24
26 Kalimnos 26,313 0.4% 0.2% 50.9%
27 Sitia 23,742 0.3% 1.1% 11,601,716
28 Syros 16,058 0.2% -19.9% 0.2% 68.4%
29 Skiros 14,593 0.2% -3.9%
30 Astypalea 12,973 0.2% 21.4% 0.2% 213.1%
31 Kastoria 11,203 0.1%
32 Kozani 4,625 0.1% 0.2% 0.2% 19.7%
33 Aktio/Preveza 3,350 0.0% 53.9%
2,885 -3.0% 0.2% 272.4%
Grand Total 100.0% NEW
6,409,323 22.3% 0.1% -4.3%
0.1% 8.6%
0.1% -12.1%
0.1% 0.1%
0.1% 2.5%
0.1% NEW
0.1% 1939.0%
0.0% NEW
0.0% NEW
0.0% 43.1%
0.0% -
0.0% 37.4%
0.0% -
0.0% -15.8%
0.0% 86.4%
0.0% -
--
--
--
--
100.0% 17.6%
aia.gr | 15