Page 12 - Aerostat Handbook 2015
P. 12
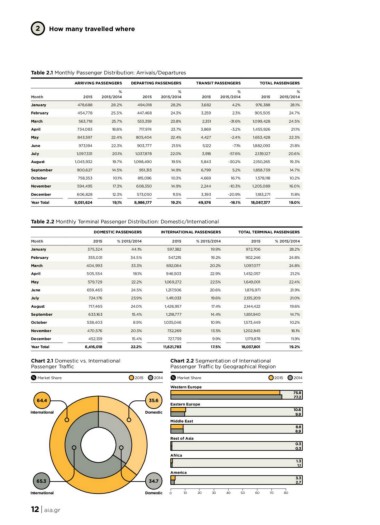
2 How many travelled where
Table 2.1 Monthly Passenger Distribution: Arrivals/Departures
ARRIVING PASSENGERS DEPARTING PASSENGERS TRANSIT PASSENGERS TOTAL PASSENGERS
Month 2015 % 2015 % 2015 % 2015 %
January 2015/2014 2015/2014 2015/2014 2015/2014
February
March 478,688 28.2% 494,018 28.2% 3,682 4.2% 976,388 28.1%
April
May 454,778 25.3% 447,468 24.3% 3,259 2.3% 905,505 24.7%
June
July 563,718 25.7% 533,359 23.8% 2,351 -31.6% 1,099,428 24.5%
August
September 734,083 18.8% 717,974 23.7% 3,869 -3.2% 1,455,926 21.1%
October
November 843,597 22.4% 805,404 22.4% 4,427 -2.4% 1,653,428 22.3%
December
Year Total 973,194 22.3% 903,777 21.5% 5,122 -7.1% 1,882,093 21.8%
1,097,331 20.1% 1,037,878 22.0% 3,918 -57.6% 2,139,127 20.6%
1,045,932 19.7% 1,098,490 19.5% 5,843 -30.2% 2,150,265 19.3%
900,627 14.5% 951,313 14.9% 6,799 5.2% 1,858,739 14.7%
758,353 10.1% 815,096 10.3% 4,669 16.7% 1,578,118 10.2%
594,495 17.3% 608,350 14.9% 2,244 -10.3% 1,205,089 16.0%
606,828 12.3% 573,050 11.5% 3,393 -20.9% 1,183,271 11.8%
9,051,624 19,1% 8,986,177 19.2% 49,576 -16.1% 18,087,377 19.0%
Table 2.2 Monthly Terminal Passenger Distribution: Domestic/International
DOMESTIC PASSENGERS INTERNATIONAL PASSENGERS TOTAL TERMINAL PASSENGERS
Month 2015 % 2015/2014 2015 % 2015/2014 2015 % 2015/2014
January 375,324 44.1% 597,382 19.9% 972,706 28.2%
February 355,031 34.5% 547,215 19.2% 902,246 24.8%
March 404,993 33.3% 692,084 20.2% 1,097,077 24.8%
April 505,554 18.1% 946,503 22.9% 1,452,057 21.2%
May 579,729 22.2% 1,069,272 22.5% 1,649,001 22.4%
June 659,465 24.5% 1,217,506 20.6% 1,876,971 21.9%
July 724,176 23.9% 1,411,033 19.6% 2,135,209 21.0%
August 717,465 24.0% 1,426,957 17.4% 2,144,422 19.6%
September 633,163 15.4% 1,218,777 14.4% 1,851,940 14.7%
October 538,403 8.9% 1,035,046 10.9% 1,573,449 10.2%
November 470,576 20.3% 732,269 13.5% 1,202,845 16.1%
December 452,139 15.4% 727,739 9.9% 1,179,878 11.9%
Year Total 6,416,018 22.2% 11,621,783 17.5% 18,037,801 19.2%
Chart 2.1 Domestic vs. International Chart 2.2 Segmentation of International
Passenger Traffic Passenger Traffic by Geographical Region
Market Share 2015 2014 Market Share 2015 2014
Western Europe
64.4
35.6 Eastern Europe 75.8
International Middle East 77.2
Domestic
65.3 10.6
Rest of Asia 9.9
International
Africa 8.8
8.9
America
0.3
34.7 0.3
1.3
1.1
3.3
2.7
Domestic 0 10 20 30 40 50 60 70 80
12 | aia.gr