Page 18 - exofilo_gr
P. 18
03. Key Figures
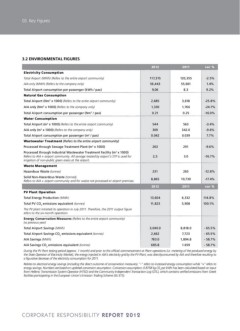
3.2 ENVIRONMENTAL FIGURES
2012 2011 var %
Electricity Consumption
Total Airport (MWh) (Refers to the entire airport community) 117,315 120,355 -2.5%
AIA only (MWh) (Refers to the company only) 56,443 55,661 1.4%
Total Airport consumption per passenger (kWh / pax) 9,06 8.3 9.2%
Natural Gas Consumption
Total Airport (Nm3 x 1000) (Refers to the entire airport community) 2,685 3,618 -25.8%
AIA only (Nm3 x 1000) (Refers to the company only) 1,330 1,766 -24.7%
Total Airport consumption per passenger (Nm3 / pax) 0.21 0.25 -16.0%
Water Consumption
Total Airport (m3 x 1000) (Refers to the entire airport community) 544 563 -3.4%
AIA only (m3 x 1000) (Refers to the company only) 309 342.0 -9.6%
Total Airport consumption per passenger (m3 / pax) 0.042 0.039 7.7%
Wastewater Τreatment (Refers to the entire airport community)
Processed through Sewage Treatment Plant (m3 x 1000) 263 291 -9.6%
Processed through Industrial Wastewater Treatment Facility (m3 x 1000) 2,5 3.0 -16.7%
Refers to AIA + airport community. All sewage treated by airport’s STP is used for
irrigation of non-public green areas at the airport.
Waste Management
Hazardous Waste (tonnes) 231 265 -12.8%
Solid Non-Hazardous Waste (tonnes) 8,865 10,730 -17.4%
Refers to AIA + airport community and for waste not processed at airport premises.
2012 2011 var %
PV Plant Operation
Total Energy Production (MWh) 13,604 6,332 114.8%
Total PV CO2 emissions equivalent (tonnes) 11,823 5,908 100.1%
The PV plant initiated its operation in July 2011. Therefore, the 2011 output figure
refers to the six-month operation.
Energy Conservation Measures (Refers to the entire airport community)
(vs previous year)
Total Airport Savings (MWh) 3,040.0 8,818.0 - 65.5%
Total Airport Savings CO2 emissions equivalent (tonnes) 2,662 7,723 - 65.5%
AIA Savings (MWh) 783.0 1,894.8 - 58.7%
AIA Savings CO2 emissions equivalent (tonnes) 685.8 1.659 - 58.7%
During the PV Pant testing period (approx. 1 month) and prior to the official commencement at Plant operations (i.e. metering of the produced energy by
the State Operator of Electricity Market), the energy injected in AIA’s electricity grid by the PV Plant, was directlyconsumed by AIA and therefore resulting to
a figurative decrease of the electricity consumption for 2011.
Relates to electrical energy savings (including the direct outcome of conservation measures). “-” refers to increased energy consumption while “+” refers to
energy savings. Numbers are based on updated conversion assumption. Conversion assumption: 0.8758 kg C02 per kWh has been calculated based on input
from Hellenic Transmission System Operator (HTSO) and the Community Independent Transaction Log (CITL), which contains verified emissions from Greek
facilities participating in the European Union’s Emission Trading Scheme (EU ETS).
CORPORATE RESPONSIBILITY REPORT 2012