Page 57 - 2board23full
P. 57
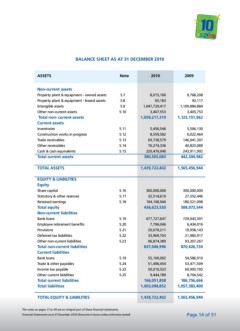
BALANCE SHEET AS AT 31 DECEMBER 2010
ASSETS Note 2010 2009
Non-current assets 8,015,166 9,768,208
65,183 93,117
Property plant & equipment - owned assets 5.7
1,047,729,417 1,109,884,884
Property plant & equipment - leased assets 5.8 3,407,553 3,405,753
Intangible assets 5.9 1,059,217,319 1,123,151,962
Other non-current assets 5.10 5,456,546 5,506,130
8,559,582 6,022,464
Total non- current assets 69,738,579 146,041,307
76,274,336 40,823,089
Current assets 220,476,040 243,911,992
380,505,083 442,304,982
Inventories 5.11
1,439,722,402 1,565,456,944
Construction works in progress 5.12
300,000,000 300,000,000
Trade receivables 5.13 32,514,610 27,552,446
Other receivables 5.14 104,108,940 180,521,098
436,623,550 508,073,544
Cash & cash equivalents 5.15
677,727,647 729,043,391
Total current assets 7,796,046 6,434,016
TOTAL ASSETS 20,679,211 19,958,143
33,969,703 21,983,917
EQUITY & LIABILITIES 96,874,389 93,207,267
837,046,996 870,626,734
Equity
55,100,092 54,586,910
Share capital 5.16 51,496,454 53,471,509
50,010,523 69,993,705
Statutory & other reserves 5.17
9,444,789 8,704,542
Retained earnings 5.18 166,051,858 186,756,666
1,003,098,852 1,057,383,400
Total equity
1,439,722,402 1,565,456,944
Non-current liabilities
Page 14 of 51
Bank loans 5.19
Employee retirement benefits 5.20
Provisions 5.21
Deferred tax liabilities 5.22
Other non-current liabilities 5.23
Total non-current liabilities
Current liabilities
Bank loans 5.19
Trade & other payables 5.24
Income tax payable 5.22
Other current liabilities 5.25
Total current liabilities
Total liabilities
TOTAL EQUITY & LIABILITIES
The notes on pages 17 to 49 are an integral part of these financial statements.
Financial Statements as at 31 December 2010 (Amounts in Euros unless otherwise stated)
ASSETS Note 2010 2009
Non-current assets 8,015,166 9,768,208
65,183 93,117
Property plant & equipment - owned assets 5.7
1,047,729,417 1,109,884,884
Property plant & equipment - leased assets 5.8 3,407,553 3,405,753
Intangible assets 5.9 1,059,217,319 1,123,151,962
Other non-current assets 5.10 5,456,546 5,506,130
8,559,582 6,022,464
Total non- current assets 69,738,579 146,041,307
76,274,336 40,823,089
Current assets 220,476,040 243,911,992
380,505,083 442,304,982
Inventories 5.11
1,439,722,402 1,565,456,944
Construction works in progress 5.12
300,000,000 300,000,000
Trade receivables 5.13 32,514,610 27,552,446
Other receivables 5.14 104,108,940 180,521,098
436,623,550 508,073,544
Cash & cash equivalents 5.15
677,727,647 729,043,391
Total current assets 7,796,046 6,434,016
TOTAL ASSETS 20,679,211 19,958,143
33,969,703 21,983,917
EQUITY & LIABILITIES 96,874,389 93,207,267
837,046,996 870,626,734
Equity
55,100,092 54,586,910
Share capital 5.16 51,496,454 53,471,509
50,010,523 69,993,705
Statutory & other reserves 5.17
9,444,789 8,704,542
Retained earnings 5.18 166,051,858 186,756,666
1,003,098,852 1,057,383,400
Total equity
1,439,722,402 1,565,456,944
Non-current liabilities
Page 14 of 51
Bank loans 5.19
Employee retirement benefits 5.20
Provisions 5.21
Deferred tax liabilities 5.22
Other non-current liabilities 5.23
Total non-current liabilities
Current liabilities
Bank loans 5.19
Trade & other payables 5.24
Income tax payable 5.22
Other current liabilities 5.25
Total current liabilities
Total liabilities
TOTAL EQUITY & LIABILITIES
The notes on pages 17 to 49 are an integral part of these financial statements.
Financial Statements as at 31 December 2010 (Amounts in Euros unless otherwise stated)