Page 70 - Aerostat Handbook 2015
P. 70
11 Europe plus the world
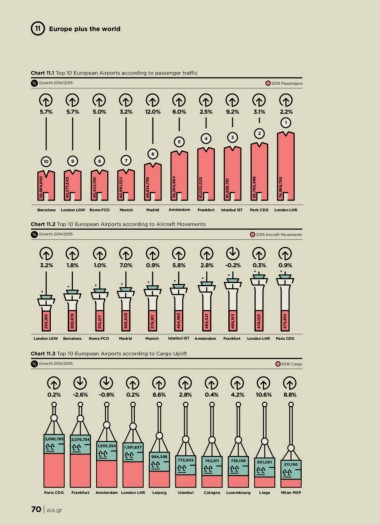
Chart 11.1 Top 10 European Airports according to passenger traffic 2015 Passengers
Growth 2014/2015
5.7% 5.7% 5.0% 3.2% 12.0% 6.0% 2.5% 9.2% 3.1% 2.2%
543 2 1
6
10 9 8 7
39,689,800
40,271,343
40,422,156
40,981,522
46,814,739
58,284,864
61,032,022
61,836,781
65,766,986
74,989,795
Barcelona London LGW Rome FCO Munich Madrid Amsterdam Frankfurt Istanbul IST Paris CDG London LHR
Chart 11.2 Top 10 European Airports according to Aircraft Movements 2015 Aircraft Movements
Growth 2014/2015
3.2% 1.8% 1.0% 7.0% 0.9% 5.8% 2.8% -0.2% 0.3% 0.9%
268,186
288,878
315,217
366,605
379,911
464,865
465,521
468,153
474,103
475,810
London LGW Barcelona Rome FCO Madrid Munich Istanbul IST Amsterdam Frankfurt London LHR Paris CDG
Chart 11.3 Top 10 European Airports according to Cargo Uplift 2015 Cargo
Growth 2014/2015
0.2% -2.6% -0.9% 0.2% 8.6% 2.8% 0.4% 4.2% 10.6% 8.8%
2,090,795 2,076,734
1,655,354 1,591,637
984,388 773,605 742,611 738,109
651,001 511,190
Paris CDG Frankfurt Amsterdam London LHR Leipzig Istanbul Cologne Luxembourg Liege Milan MXP
70 | aia.gr