Page 53 - Ath Airport Profile
P. 53
Joining the Passenger Dots 51
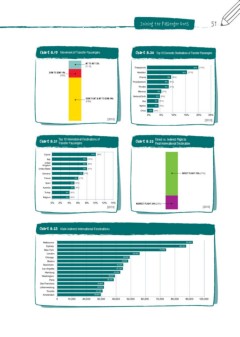
Chart 8.19 Movement of Transfer Passengers Chart 8.20
05;;605; Thessaloniki 20% [17%]
BD 16% [17%]
+64;6+64 Heraklion 15% 20% 25%
BD
Chania 9% [9%] BD
Thira/Santorini 8% [9%]
Rhodes 8% [7%]
Mikonos 6% [7%]
+64;605;
05;;6+64 Kerkyra/Corfu 5% [5%]
BD
Kos 4% [5%]
BD
Mytilini 4% [4%]
Chios 2% [3%] 10%
0% 5%
Chart 8.21 Top 10 International Destinations of Chart 8.22 Direct vs. Indirect Flight to
Transfer Passengers Final International Destination
Cyprus 10% [9%]
8% [12%]
Italy 8% [8%]
United 8% [7%]
Kingdom
United States
Germany 7% [7%] +09,*;-30./;BD
France 6% [7%]
Spain 5% [5%]
Australia 5% [4%]
Turkey 4% [4%]
Belgium 4% [3%]
0% 2% 4% 6% 8% 10% 12% 14% 05+09,*;-30./;B D
BD BD
Chart 8.23 Main Indirect International Destinations
Melbourne 92,800
Sydney 86,100
New York 73,500
London
56,900
Chicago
Boston 49,000
Stockholm 48,200
Los Angeles
45,200
Hamburg
Washington 45,100
Paris 43,000
San Francisco
Johannesburg 39,000
Toronto 38,100
Amsterdam
32,800
0
32,200
31,100
29,800
10,000 20,000 30,000 40,000 50,000 60,000 70,000 80,000 90,000 100,000