Page 29 - Ath Airport Profile
P. 29
Tonnes up in the Sky 27
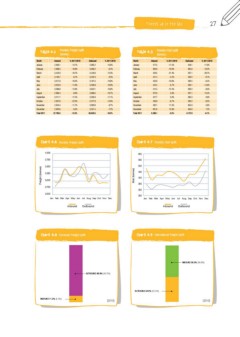
Table 4.2 Monthly Freight Uplift Table 4.3 Monthly Mail Uplift
(tonnes) (tonnes)
Month Inbound % 2011/2010 Outbound % 2011/2010 Month Inbound % 2011/2010 Outbound % 2011/2010
January 2,956.1 -13.1% 2,805.2 -13.6% January 477.5 -11.5% 346.1 -11.0%
February 2,988.5 -10.9% 3,056.2 -0.4% February 383.0 -19.6% 305.0 -10.2%
March 3,425.0 -16.7% 3,446.0 -12.3% March 420.5 -21.3% 337.1 -26.7%
April 3,195.7 -8.1% 3,225.3 -3.3% April 421.4 -4.2% 340.2 -0.1%
May 3,311.8 -16.3% 3,161.5 -10.8% May 453.9 -10.6% 330.5 -6.4%
June 3,525.9 -11.6% 3,330.9 -10.9% June 443.4 -5.7% 320.1 -14.0%
July 3,386.8 -12.9% 3,643.1 -10.8% July 412.4 -12.4% 339.2 -9.3%
August 2,969.4 -8.9% 3,068.5 -16.7% August 372.0 5.8% 337.1 15.4%
September 3,211.7 -17.4% 3,295.8 -11.1% September 427.7 3.0% 365.3 0.9%
October 2,937.8 -22.3% 3,277.8 -14.8% October 430.9 -6.7% 330.2 -9.2%
November 2,943.4 -11.7% 3,093.8 -8.7% November 492.1 11.5% 364.0 5.0%
December 2,933.6 -6.5% 3,231.4 -7.2% December 561.6 15.8% 458.0 1.2%
Total 2011 37,785.5 -13.3% 38,635.5 -10.3% Total 2011 -5.3% -6.1%
5,296.1 4,172.9
Chart 4.6 Monthly Freight Uplift Chart 4.7 Monthly Mail Uplift
4,500 600
3,750 550
3,500 500
3,250 450
3,000 400
2,750 350
2,500 300
250
Jan Feb Mar Apr May Jun Jul Aug Sep Oct Nov Dec
Jan Feb Mar Apr May Jun Jul Aug Sep Oct Nov Dec
Inbound Outbound
Freight (tonnes) Inbound Outbound
Mail (tonnes)
Chart 4.8 Domestic Freight Uplift Chart 4.9 International Freight Uplift
6<;)6<5+B D 6<;)6<5+BD 05)6<5+BD
05)6<5+B D BD BD