Page 58 - Ath Airport Profile
P. 58
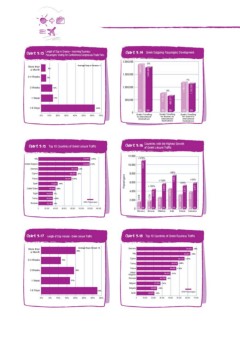
Chart 9.13 Length of Stay in Greece – Incoming Business Chart 9.14 Greek Outgoing Passengers Development
Passengers Visiting for Conferences/Congresses/Trade Fairs
2,000,000 -2%
More than Average Days in Greece: 4 1,886,822
a Month 1,845,893
5% 1,500,000 718,149
3-4 Weeks 6% 1,000,000 693,571
1,168,473
2 Weeks 12% 500,000 1,152,322-1%
-3%
1 Week 14%
1-6 Days 62% 08 09 08 09 08 09
0
0% 10% 20% 30% 40% 50% 60% 70% Greeks Travelling Greeks Travelling
Greeks Travelling for Business to for Leisure to
to International International International
Destinations Destinations
Destinations
Chart 9.15 Top 10 Countries of Greek Leisure Traffic Chart 9.16 Countries with the Highest Growth
of Greek Leisure Traffic
Italy 120,994 +22% 12,000 +578%
United Kingdom 10,000
119,496 +13% 10,947
Germany 92,416 +2%
Cyprus 89,074 -2% 8,000 +65%
France 6,000
Spain 76,975 +37% Passengers 4,000 +133% 7,605 +54%
+153% +64%
United States 44,825 +6%
Egypt
Turkey 39,409 -28% 5,646 5,301 3,808
5,877
Romania 33,533 -7% 1,731 4,616
0 4,379
33,302 +35% 1,616 3,231
33,302 -4% 2,000 2,423
2009 Passengers 0 08 09 08 09 08 09 08 09 08 09 08 09
20,000 40,000 60,000 80,000 100,000 120,000 140,000 Morocco Norway Maldives India Finland Indonesia
Chart 9.17 Length of Stay Abroad - Greek Leisure Traffic Chart 9.18 Top 10 Countries of Greek Business Traffic
More than Average Days Abroad: 16 Germany 65,820 +8%
a Month 20% Italy
3-4 Weeks Cyprus 62,907 -10%
Turkey
12% France 56,110 +21%
United 48,273 +58%
Kingdom
2 Weeks 19% Romania 46,469 +12%
Belgium
Bulgaria 39,672 -21%
Spain
1 Week 17% 34,748 -3%
0
27,951 -14%
1-6 Days 33% 23,928 -16% 40,000 2009 Passengers
0% 5% 10% 15% 20% 25% 30% 35% 20,876 -13% 50,000 60,000 70,000
10,000 20,000 30,000