Page 47 - Ath Airport Profile
P. 47
Our Grade Report 45
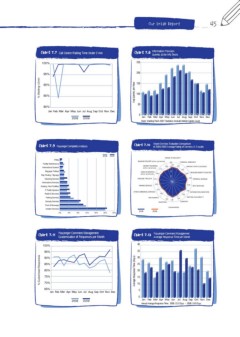
Chart 7.7 Call Centre Waiting Time Under 2 min Chart 7.8 Information Provision
Queries at the Info Desks
100%
250
95%
200
90%
85%
80%
Jan Feb Mar Apr May Jun Jul Aug Sep Oct Nov Dec
2008 2009
% Waiting<2min 150
Avg Queries per Hour
100
50
0 08 09 08 09 08 09 08 09 08 09 08 09 08 09 08 09 08 09 08 09 08 09 08 09
Jan Feb Mar Apr May Jun Jul Aug Sep Oct Nov Dec
Note: Starting From 2007 Statistics Include Mobile Agents Load
Chart 7.9 Passenger Complaints Analysis Chart 7.10 Airport Services Evaluation Comparison
of 2008-2009 Average Rating of Services (1-5 scale)
2008 2009 SENSE OF SECURITY
PRMs BAGGAGE DELIVERY (airline / gh services) 5 TERMINAL AMBIENCE
Facility Maintenance 3.75 AIRPORT STAFF COURTESY
Informations Screens AIRCRAFT BOARDING 3.66 3.94
(airline / gh services) 3.74 3.57
Baggage Trolleys CHECK-IN SERVICES 4 3.85 REDUCED MOBILITY FACILITIES
(airline / gh services) 3.82 3 3.95 TERMINAL SIGNAGE
Way Finding / Signage
2 3.63 INFO SERVICES
Cleaning Services BAGGAGE TROLLEYS 3.78
1
Informations Services
Seating / Rest Facilities 3.56
PARKING SERVICES
IT Public Systems
OTHER COMMERCIAL SERVICES 3.41 3.92
Retail & Sercvices 3.32 INFORMATION MONITORS
Parking Services RESTAURANTS 3.66 3.50
SEATING AVAILABILITY
Security Services 3.96
3.76
SHOPPING
COMFORT
Food & Beverage CLEANLINESS
Aviation Services
2008 2009
0% 4% 8% 12% 16% 20% 24%
Chart 7.11 Passenger Comment Management Chart 7.12 Passenger Comment Management
Customisation of Responses per Month Average Response Time per Month
100% 40
95%
90% 35
85% 30
80% 25
75% 20
70% 15
65% 10
Jan Feb Mar Apr May Jun Jul Aug Sep Oct Nov Dec 5
% Customised Responses 0
Average Response Time (Days)
Jan Feb Mar Apr May Jun Jul Aug Sep Oct Nov Dec
2008 2009 Annual Average Response Time: 2009: 22.2 Days - 2008: 24.9 Days