Page 40 - Ath Airport Profile
P. 40
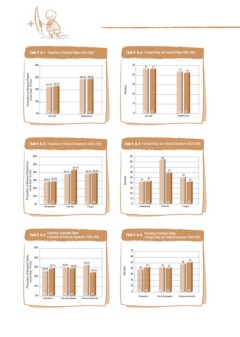
Chart 6.1 Proportion of Delayed Flights 2008-2009 Chart 6.2 Average Delay per Delayed Flight 2008-2009
40% 50 47 47
40
Proportion of Delayed Flights 30% 29.0% 29.2% 44 43
(more than 15 min) 30
22.4% 23.2% Minutes 08 09
20% 20
Departures
10% 08 09 10
0% 08 09 Departures 0 08 09
Arrivals Arrivals
Chart 6.3 Proportion of Delayed Departures 2008-2009 Chart 6.4 Average Delay per Delayed Departure 2008-2009
60% 90 84
58
Proportion of Delayed Departures 50% 80
(more than 15 min) 08 09
43.4% 70
Charter
40% 38.1% 38.4% 38.6% 60
30% 28.3% 28.5% Minutes 50 42 43 50
40 42
20%
30 08 09
10% 08 09 08 09
20 Cargo
0% 08 09 Charter Cargo
10
Scheduled
0 08 09
Scheduled
Chart 6.5 Departing Scheduled Flights Chart 6.6 Departing Scheduled Flights
Proportion of Delayed Departures 2008-2009 Average Delay per Delayed Departure 2008-2009
50%
Proportion of Delayed Flights 40% 70 48 50
(more than 15 min) 60
30% 28.7% 29.9% 28.9% 32.3% Minutes 50 43 42
25.9% 24.4%
43
20% 40 39
30
10% 08 09 08 09 20 08 09 08 09
10
0% 08 09 Intra-European Intercontinental Intra-European Intercontinental
0 08 09
Domestic
Domestic